Quantitative analysis
This page details the findings and statistics to support our business venture that will display the successful and reason behind our decisions within our business. they are findings of facts to support and give guidance and a level of authority and trust to our investors.
Introduction for growth in northern suburbs for Housing
The northern suburbs of Perth has become a sought after area for investment. This area is serviced by Joondalup railway and the Mitchell Freeway which offer a direct and convenient way to Perth CBD. This area is located 15 to 25 kilometres north of Perth. An average travel times is about 15-20 minutes by train and 35 minutes by car to Perth CBD.
There are many potential properties which are more than 20 years old and priced lower than $500,000. These properties are extremely reasonable and undervalued. Therefore, RtR have chosen Beldon, Heathridge, Craigie and Padbury as its major targeted locations.
The diagrams below will detail the growth rate and median house price of targeted suburbs over 12-month period of time and compare analyse the sales volume of selected locations based on quantitative research.
Diagram 1: Comparing the growth rate of targeted suburbs over the past year

Diagram 1 demonstrates that West Perth suburb has the lowest growth rate, it seems to be well developed, compared to Beldon and Heathridge suburbs. O’Rourke (2013), the principal and licensee of O’Rourke Realty Investments, stressed that Beldon and Heathridge are potential markets for investors. These suburbs are also ranked as his top 10 suburbs list. During 12 months, Beldon and Heathridge have 11.7% and 13.4% of growth rate. This shows these areas have high demand and comprise a number of valuable properties.
Diagram 2: Median house Price in Perth by September 2013

This diagram reveals the properties of West Perth ($774,000) and Stirling suburb ($760,000) are the most expensive. The following one is the suburb of Tuart Hill, average house price is $542200 and Padbury suburb is just slightly over half million. This research shows the houses of Beldon, Heathridge and Craigie are approximately 30% low-priced than the top two.
|
Diagram 3: Beldon & Heathridge vs. West Perth Annual Median House Sales Volume

Diagram 3 evidently shows Heathridge area has the highest sales volume and has soared more than 70% since 2009. Beldon’s sales volume started at 103 in 2009 and has decreased to 69 in 2010, however, it will maintain a certain high volume in recent years. On the other hand, West Perth suburb seems lack of land to expand; its sales volume has been low with no significant improvement over the past 4 years.
|
Diagram 4: Craigie vs. Tuart Hill Annual Median House Sales Volume

Compared to Tuart Hill suburb, Craigie maintains such a high sales volume which is between 126 and 137 in each year. This diagram shows Craigie suburb has various types of potential properties which are well-priced and valuable. This induced a lot of buyers to purchase and the sales volume of Tuart Hill has decreased nearly 17% over the past 4 years.
|
Diagram 5: Padbury vs. Stirling Annual Median House Sales Volume

Diagram 5 reveals Stirling’s sales volume had decreased more than 20% between 2010 and 2012, thus soared nearly 50% in 2013. Padbury’s sales volume has been decreasing, however, it still maintains higher volume overall. Padbury’s house price is roughly 30% lower than Stirling area. It seems to be more reasonable and affordable. Therefore, Padbury has been ranked as one of the top 10 best performing investment suburbs and also offers more opportunities for RtR to facilitate its business (O’Rourke, 2013).
|
Overall analysis of growth in Northan suburbs
Blogger: Rory O'Rourke, O’Rourke Realty Investments(Rory O’Rourke is the principal and licensee of O’Rourke Realty Investments in Perth and has been in the property industry for over 40 years. Rory is a former Vice President of the International Real Estate Federation (FIABCI) Australian Chapter and was inducted into the International Who’s Who of Professionals for 2009/2010. He has authored 3 bestselling books ‘Born Free Taxed to Death’, ‘I sold 22 homes in one day’ and ‘It’s Time… the Republic of Australia’.)
"After being personally involved in the Perth real estate market for more than 40 years, the majority of my top 10 picks for the best performing investment suburbs during the 2013 are located north of the river.
Now is a terrific time to consider buying an investment property with property prices still stable and rental vacancy rates at historic low levels.
REIWA figures show that the rental vacancy rate in Perth is just 1.8% and the median weekly rents jumped by nearly 14% over the last year.
At the same time the number of properties listed for sale dropped by 30% over the past year during a time when sales jumped by 19%. With stock levels falling and sales increasing, it is only a question of time before property prices begin to rise.
There are a large number of mid-priced suburbs north of the river which are about to ‘bust open’ because properties in these areas are undervalued.
First time property investors should be targeting northern coastal suburbs where new building land is scare and homes are more than 25 years of over.
The fact is that land appreciates in value and the building themselves depreciate in value. Therefore, if you buy a home in a coastal location where there are few new building lots and the houses are more than 25 years old, then you have the very real certainty of enjoying high levels of capital growth.
Astute property investors should target mid-priced suburbs which have demonstrated strong levels of capital growth over the longer term.
A good example is the suburb of Beldon which has houses more than 25 years of age. There are very few new building lots in this coastal suburb and the average median price of a home has increased by 10.7% annually during the past decade. Properties in the suburb are popular with renters as it has a high level of social infrastructure such as schools, shop and public transport.
Large new land developments planned for around the Yanchep area will make these older, less expensive homes in coastal suburbs closer to the city more valuable during the coming years.
At the same time, many of these mid-priced coastal suburbs are now delivering rental returns in excess of 5% due to rising rents over the past two years.
If many of these northern coastal suburbs revert to the their long term capital growth rates, combined with rental returns, then astute first home investors could achieve annual returns of nearly 20% even though borrowing costs are at near record lows.
The top 10 list includes the suburbs of Scarborough, Victoria Park and South Perth where you can buy an older style apartment for near land value. After cosmetic improvements, or furnish same the rents in these older apartments can be substantially boosted."
Here are my top 5 suburbs for 2013:
Beldon,Heathridge,Craigie,Padbury and Warwick. the diagrams graphs and explanations above give descriptions as to why and they were analysed against many others as to there growth and the potential to develop them into our property. these areas were choose because of there potential in the market of this day and age.
the top two are Beldon and Heathridge.
Beldon/Heathridge
Another very affordable coastal area of Perth where the median house price is under $400,000. Properties in these nearby suburbs have recorded high levels of capital growth over the last decade, with an annual price growth rate of over 13.1 per cent. The homes are generally on big blocks and first-home buyers should benefit from rising land values because of the scarcity of building blocks in this area of Perth
Experts pick best suburbs July 28, 2009 (Perth now.com.au)
Joondalup planning
Development Control Policy 1.6 — Planning to Support Transit Use and Transit Oriented
Development Control Policy 1.6 — Planning to Support Transit Use and Transit Oriented Development sets
out the position of the Western Australian Planning Commission in relation to future development in a transitoriented precinct. One of the policy objectives is to ensure the ‘optimal use of land within transit-oriented precincts by encouraging the development of uses and activities that will benefit from their proximity and accessibility to public transport and which in turn, will generate a demand for the use of transit infrastructure and services.’ The Policy defines a ‘transit-oriented precinct’ as one in which the threshold for walking to those facilities is:
ƒ. approximately 10 to 15 minutes, or an 800 metres distance for train stations, transit interchanges or major bus transfer stations or terminals; and ƒ. approximately 5 to 7 minutes walking time or 400 metres for bus stops located on bus routes with multiple bus services that are high-frequency of 15 minutes or less during peak periods.
There are 6 railways stations in the City of Joondalup and a network of public transport bus routes servicing the local and regional transport needs of the City. The bus routes are well integrated with train services at Joondalup, Greenwood, Whitfords and Warwick Stations and provide a high degree of accessibility to local facilities and amenities.
Rental pricing
|
2011 Oct - Dec
We are looking at the weekly rent for the 2012 Oct - Dec as we can see the weekly rent in Padbury is at the highest, we will now need to focus on the cost of the properties in Padbury to decide if we purchase a house in that area and can get $470.00 max rent a week, would this be more beneficial to our Company. |
|
|
2013 jan- march
In the 2013 year for the Jan - March we can notice that Padbury weekly rental income has dropped. So if the company did not already have a year’s tenancy agreement in place we would not be able to collect as much rent from Jan-March 2013. We would now want to also look at the cost of properties in Beldon as you will notice each month the requirements and income will change so we would need to move fast when purchasing and preparing the rental properties. |

|
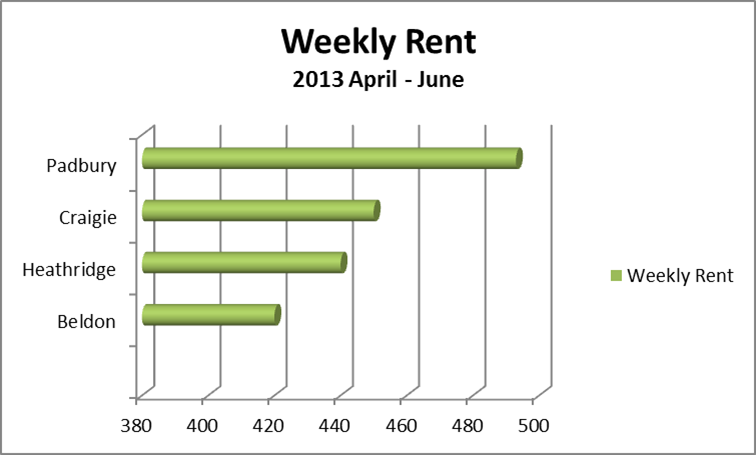
2013 April-semptember

|

|
We can now see from the last six months of the 2013 year that Padbury is still
the most worthy rental location and this would make for a worthy rental investment location.
the most worthy rental location and this would make for a worthy rental investment location.
| median_and_mean_word_doc._1.docx |
excel documents for graphs
| 1.b_n_h_vs_wp_annual_median_house_sales_volume.xlsx |
| 2._padbury_vs._stirling_annual_median_house_sales_volume.xlsx |
| 3_c_vs_th_annual_median_house_sales_volume.xlsx |
| 4._comparing_the_graw_rate_t1.xlsx |
